HOME IAQ DATA PROJECT
The largest volume of residential IAQ data ever collected with calibrated equipmentIn this ongoing project, we are compiling and analyzing IAQ data from more than 250,000 homes over multiple years. AirAdvice is excited to share our findings to further knowledge of residential environments.
PROJECT BACKGROUND
THE PROJECT TEAM
- This project is a joint effort between Dr. Elliott Gall and his team from Portland State University and AirAdvice for Homes team. The Healthy Buildings Research Laboratory (HBRL) is the research laboratory of Dr. Elliott Gall, Associate Professor of Mechanical and Materials Engineering. The HBRL aims to understand the fundamental principles that govern our exposure to air pollution in indoor environments.
- The data was automatically collected by hundreds of AirAdvice contractors using M5200 monitors.
THE DETAILS
- Multi-year project (2016-present).
- Includes results of 250,000 IAQ reports.
- More data and reports will be added.
- Parameters measured include VOCs, Carbon Dioxide, Particulate matter (PM 10 and PM 2.5), Temperature, Relative Humidity, Carbon Monoxide, and Pressure.
- Time stamp, date, and zip code also collected.
WHY THIS PROJECT IS UNIQUE
- The homes tested did not request a test, and were not pre-selected. This gives us a better picture of the average home, instead of solely homes with known or suspected IAQ problems.
- Its sheer volume makes this data set likely the largest volume of residential IAQ data collected.
RECENT FINDINGS
Updated June 2023
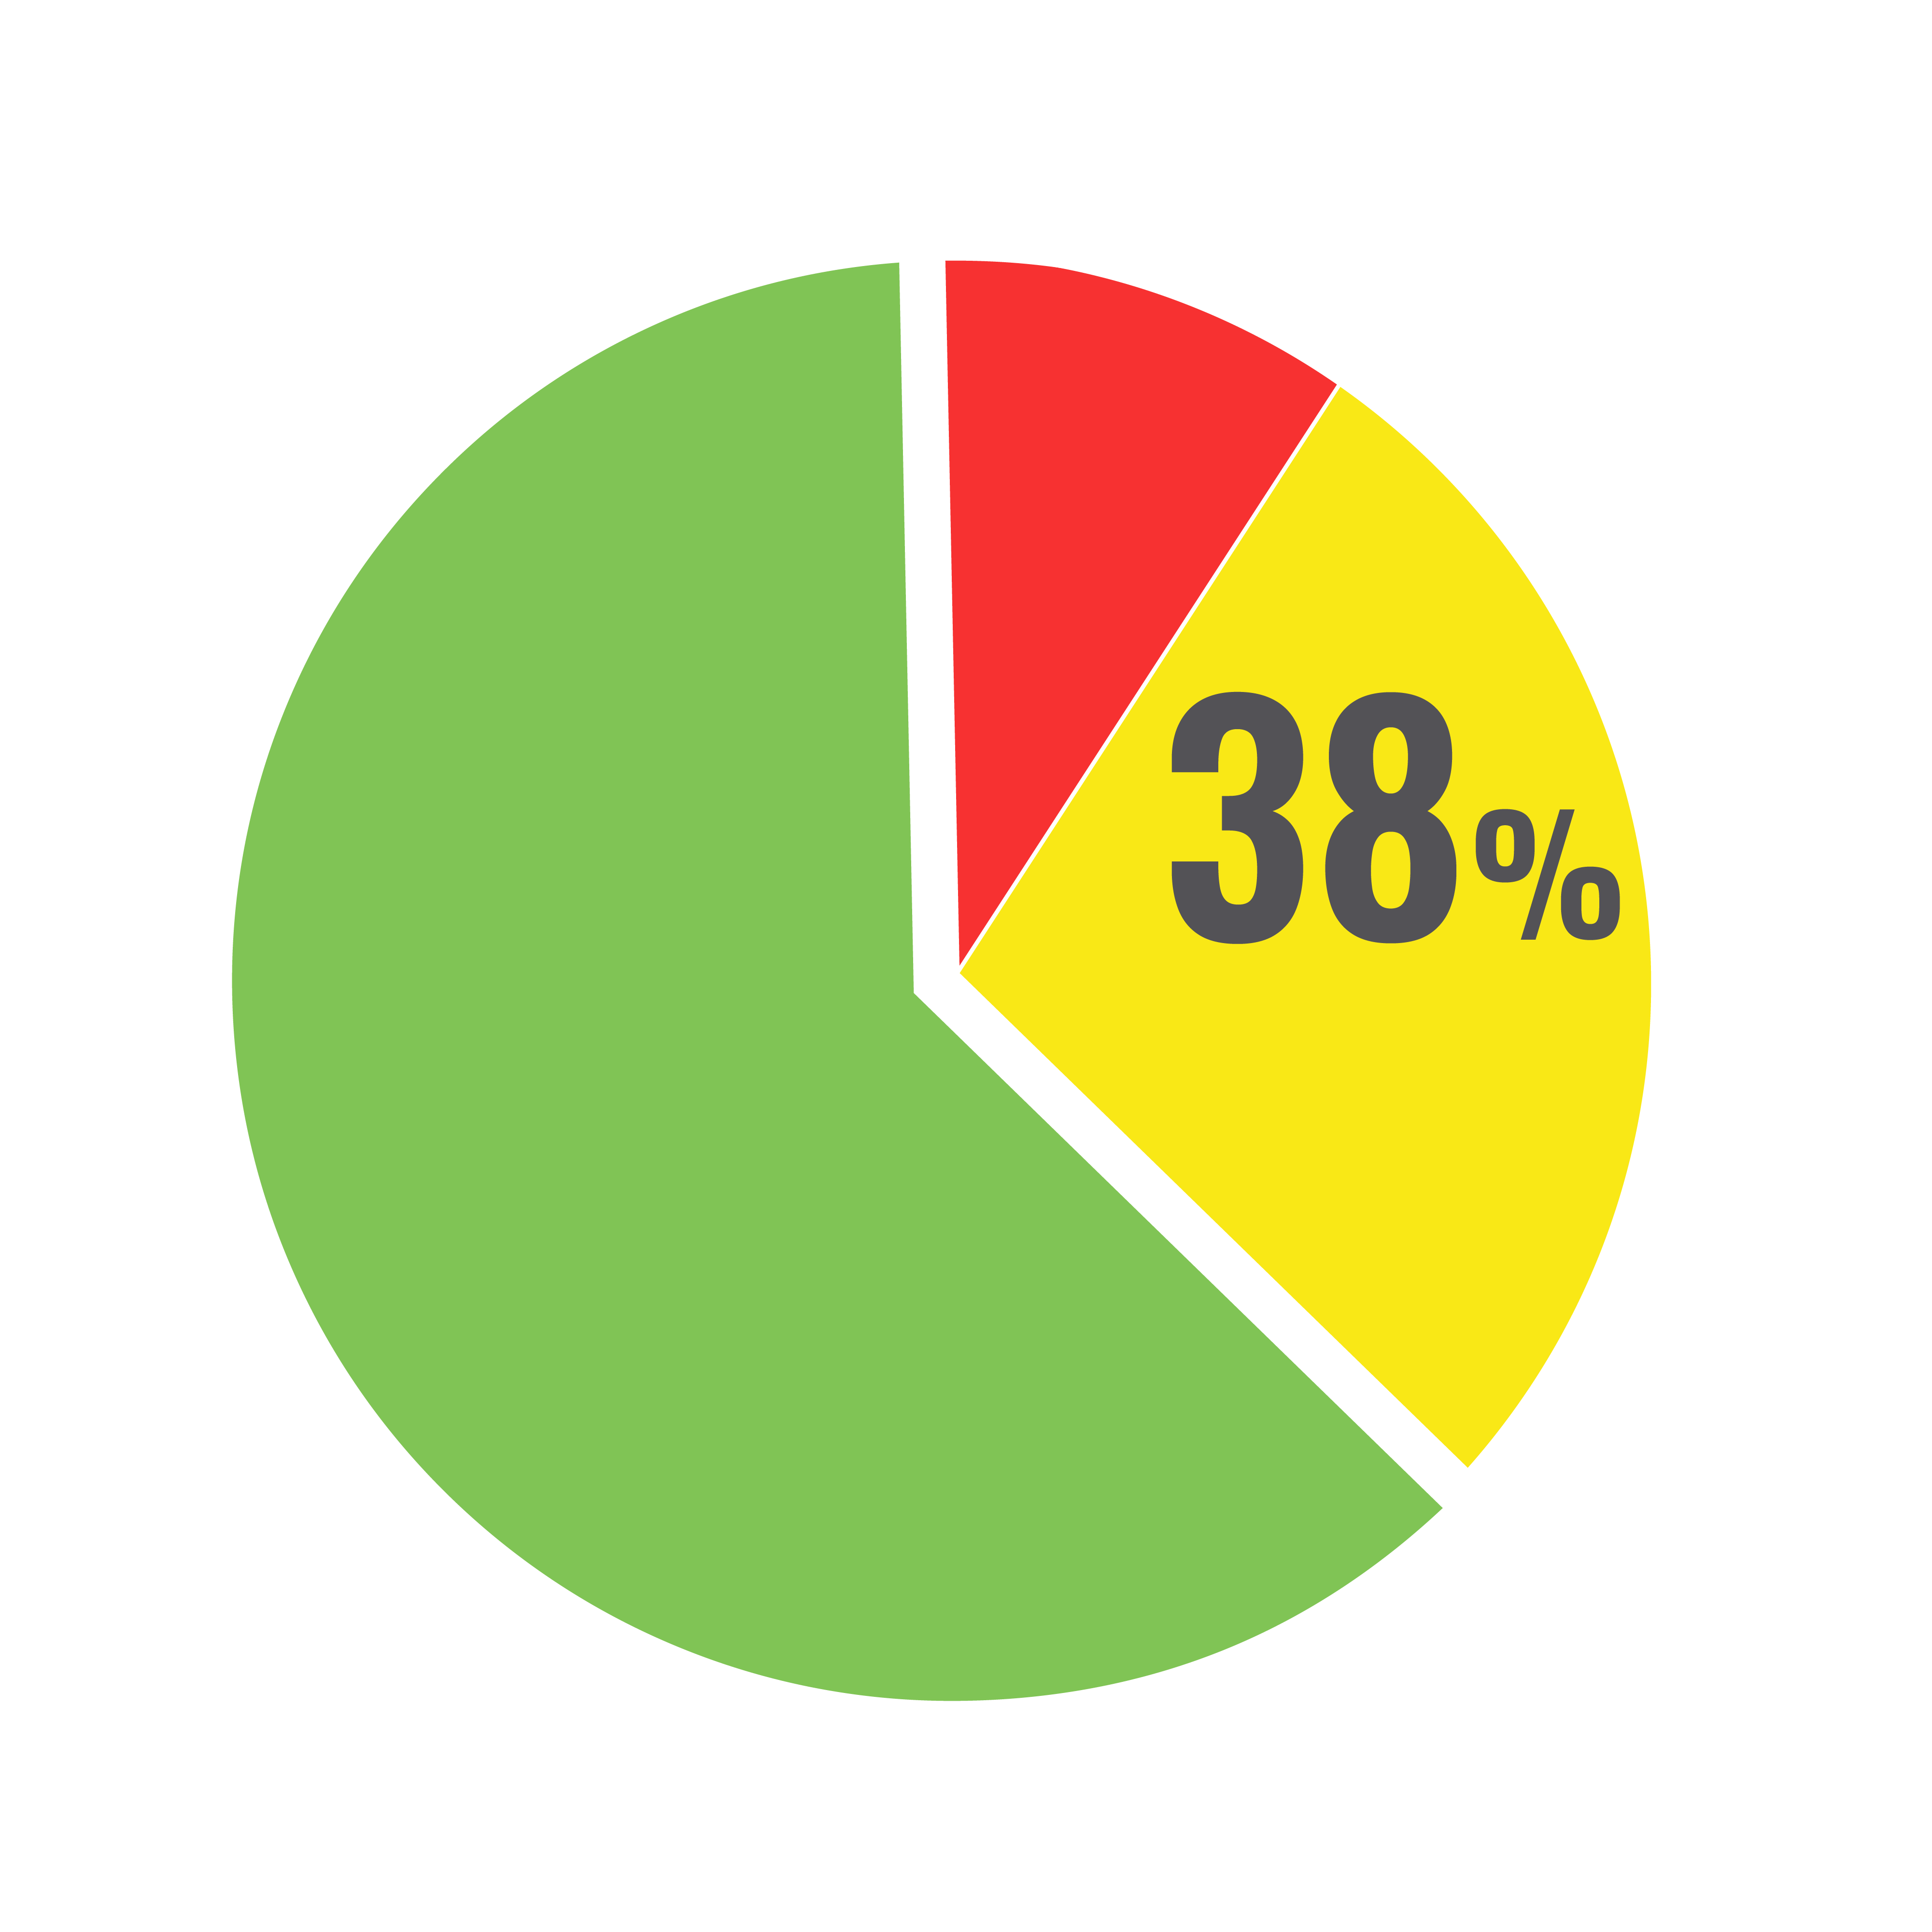
38% of homes tested have VOCs (Volatile Organic Compounds) over 500ug/m3, which is a higher level than is deemed safe.
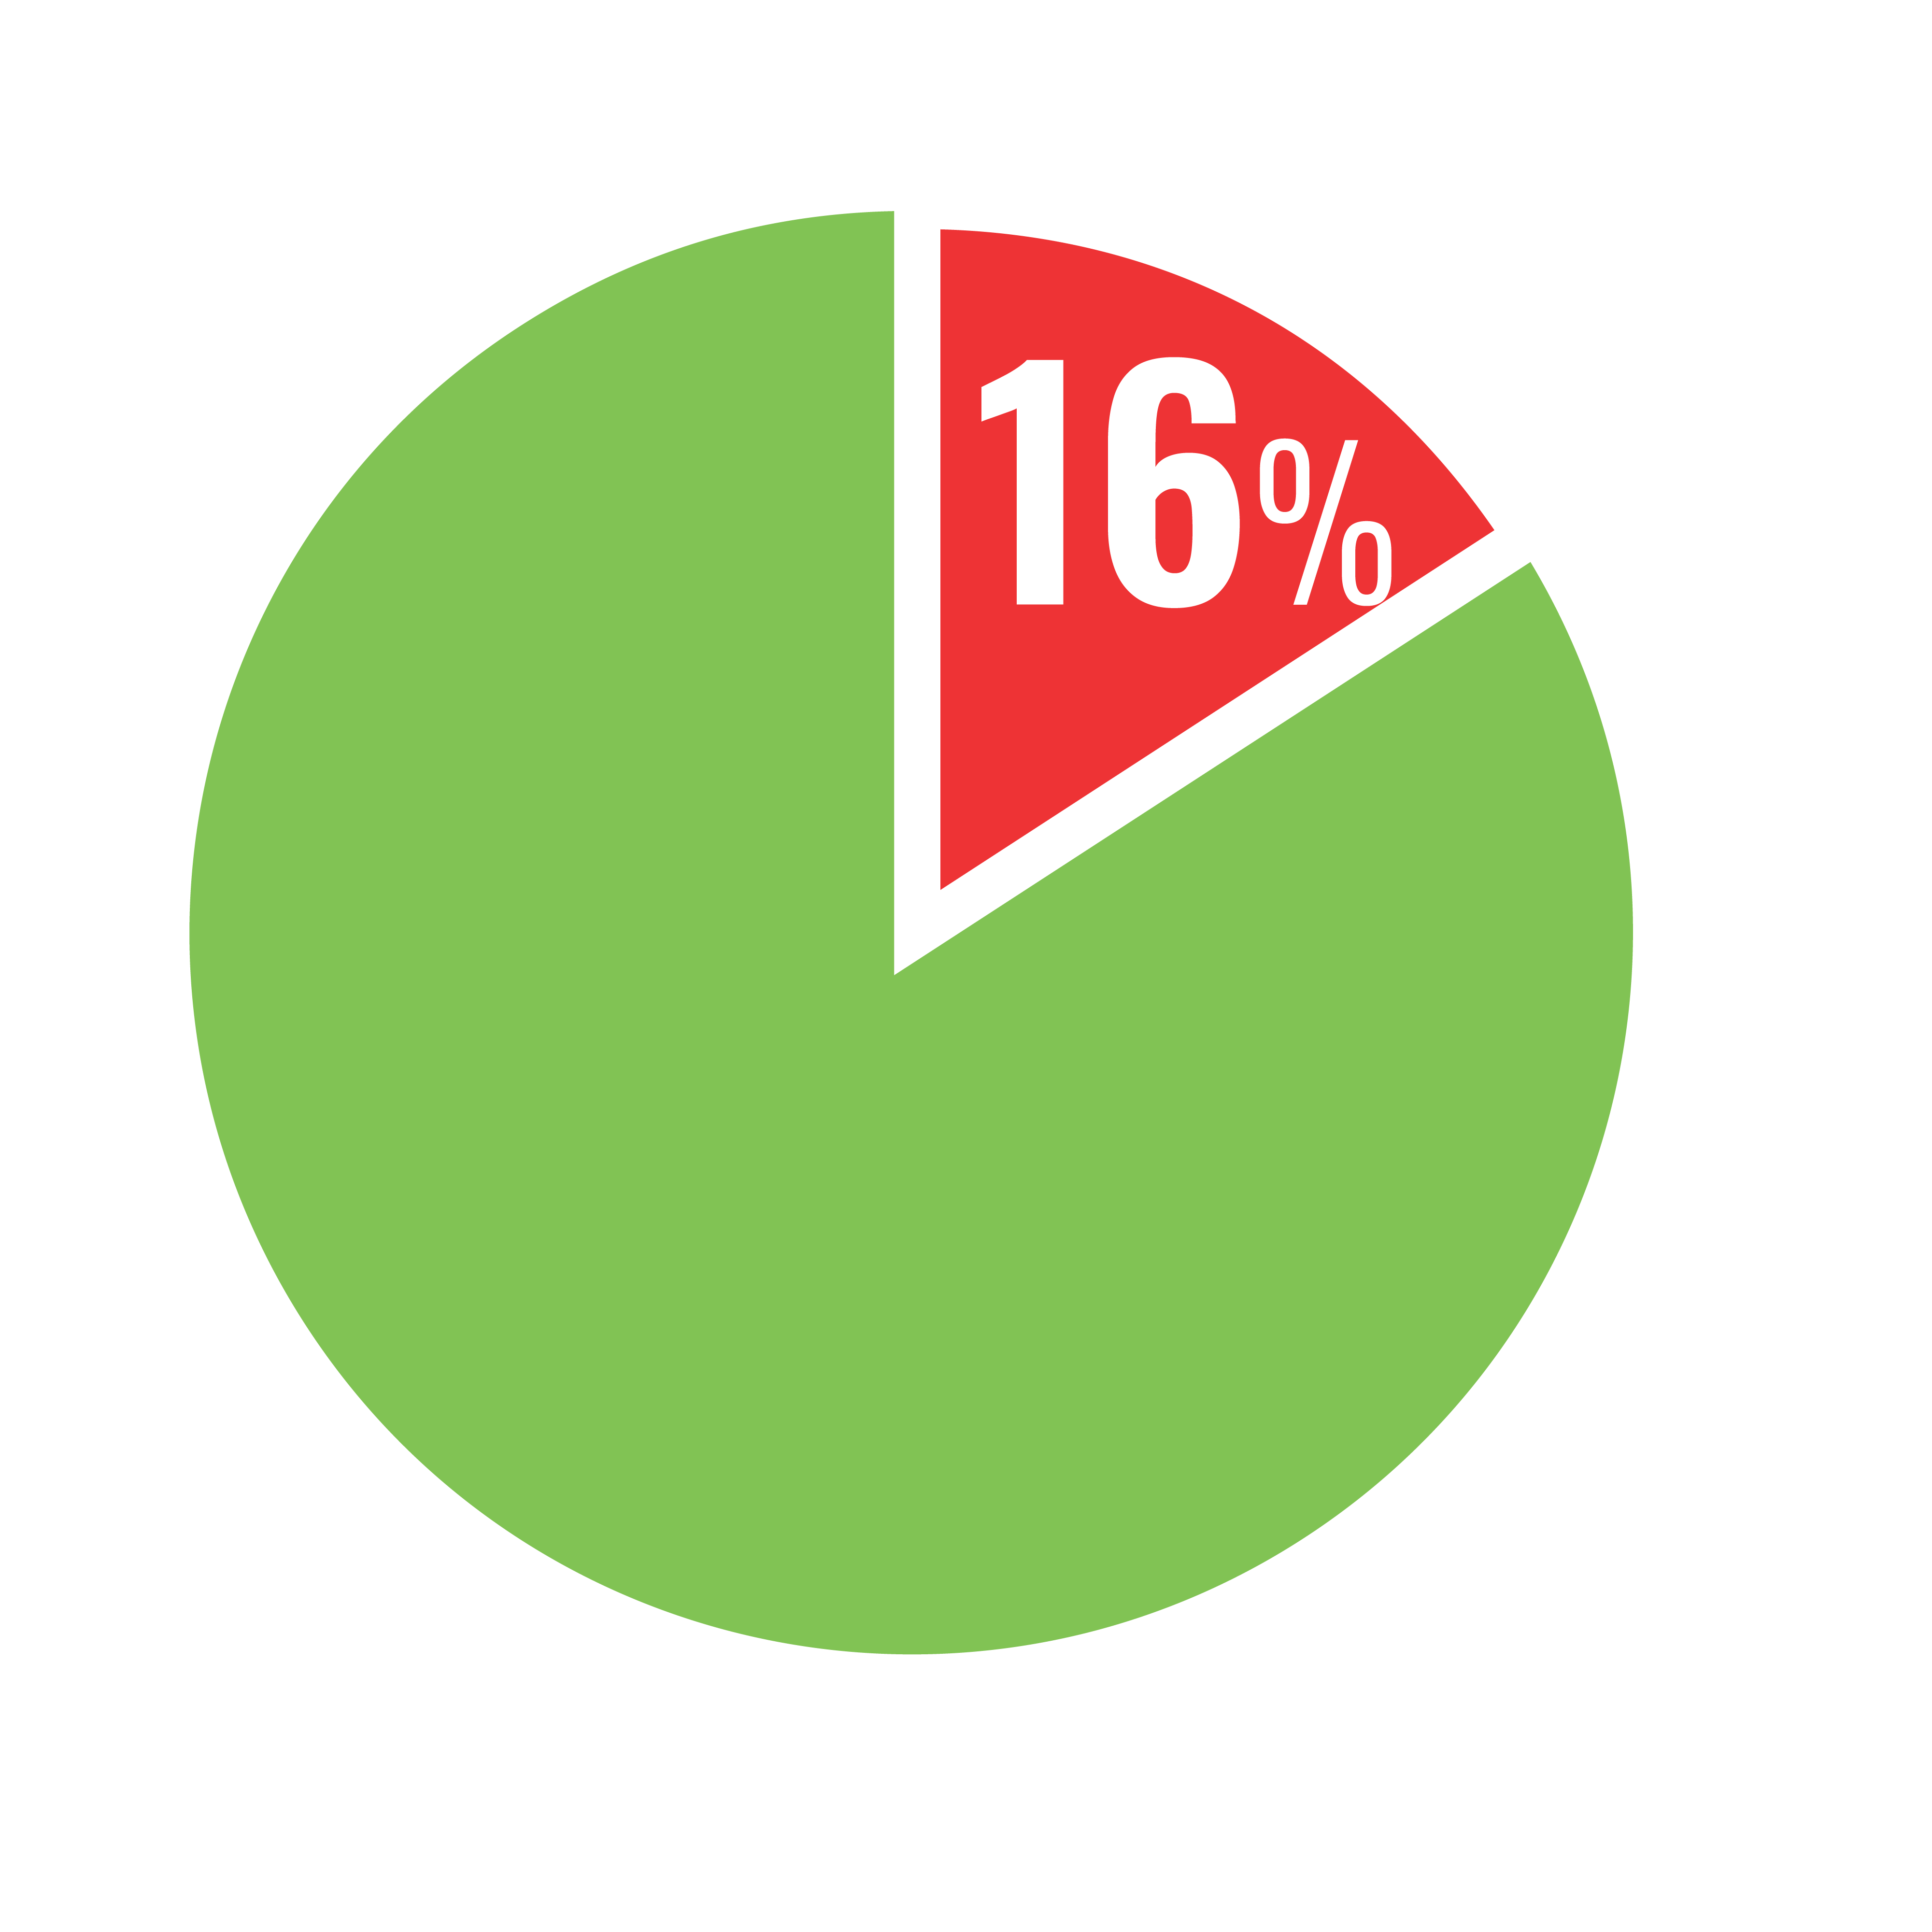
Indoor relative humidity (RH) should be kept between 30% – 50% if possible and certainly below 60%. Our data shows that 16% of homes tested were above 59%.
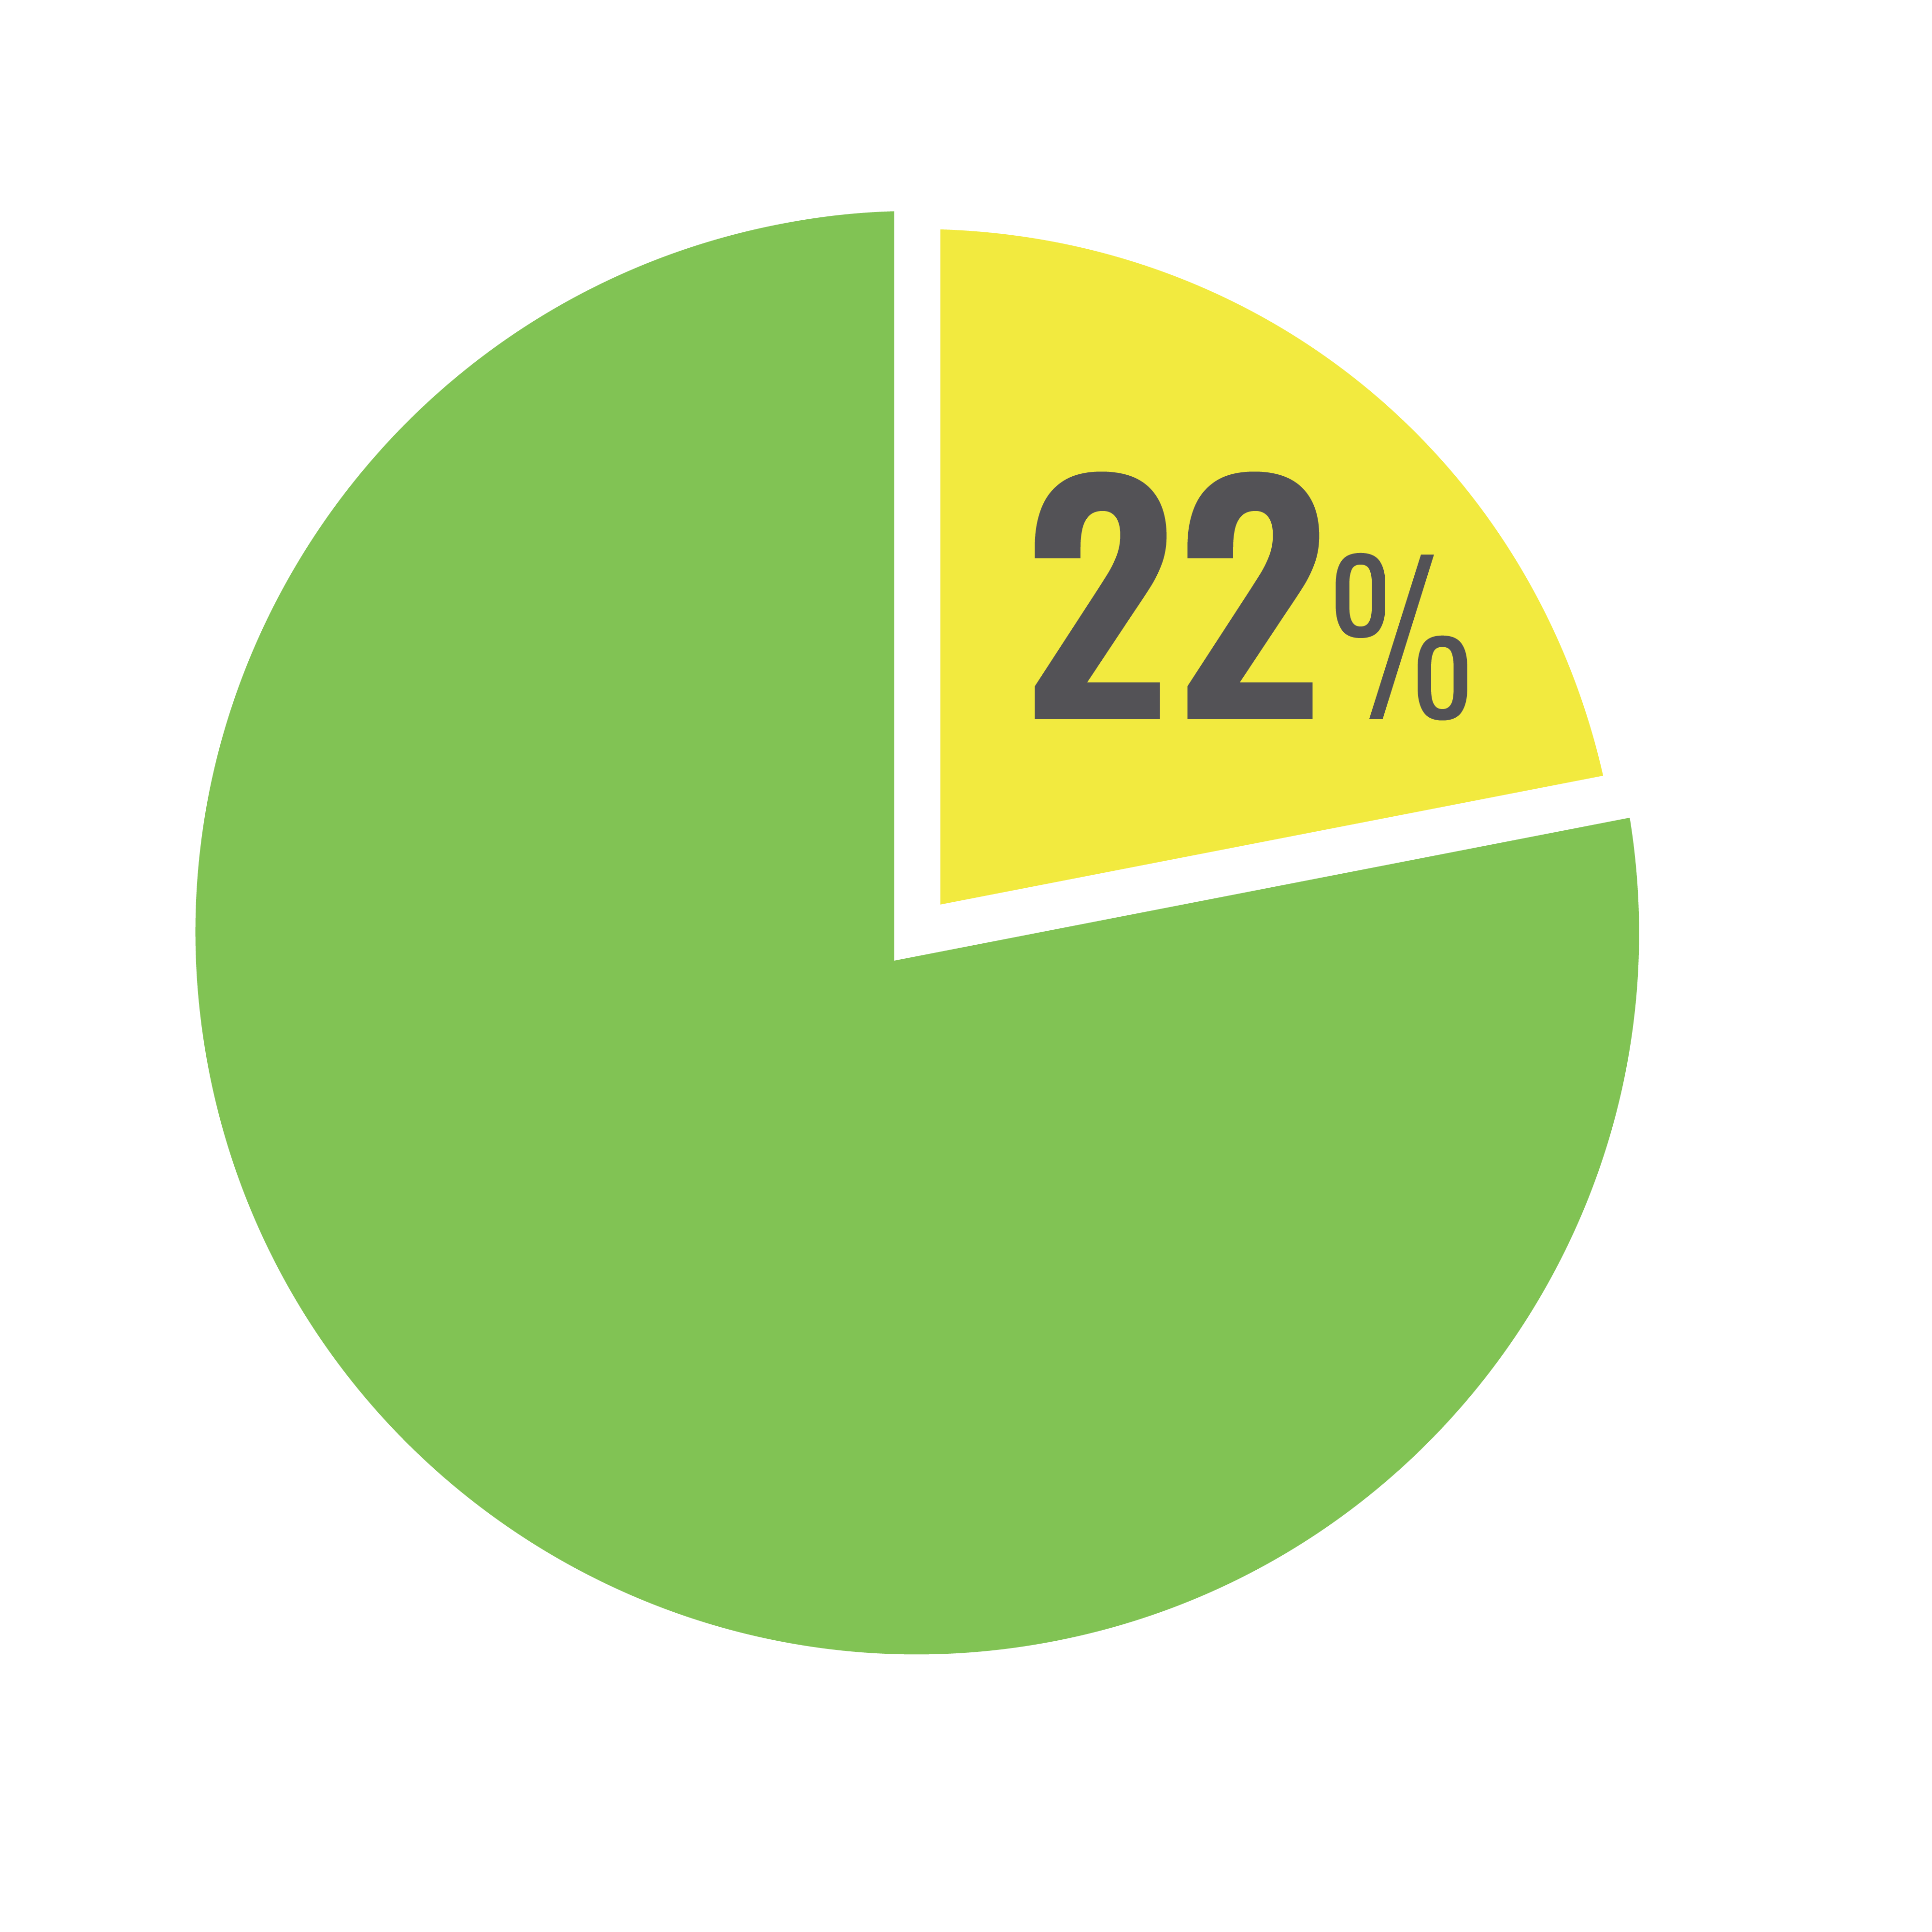
Particle levels (PM10) are elevated in 22% of homes.
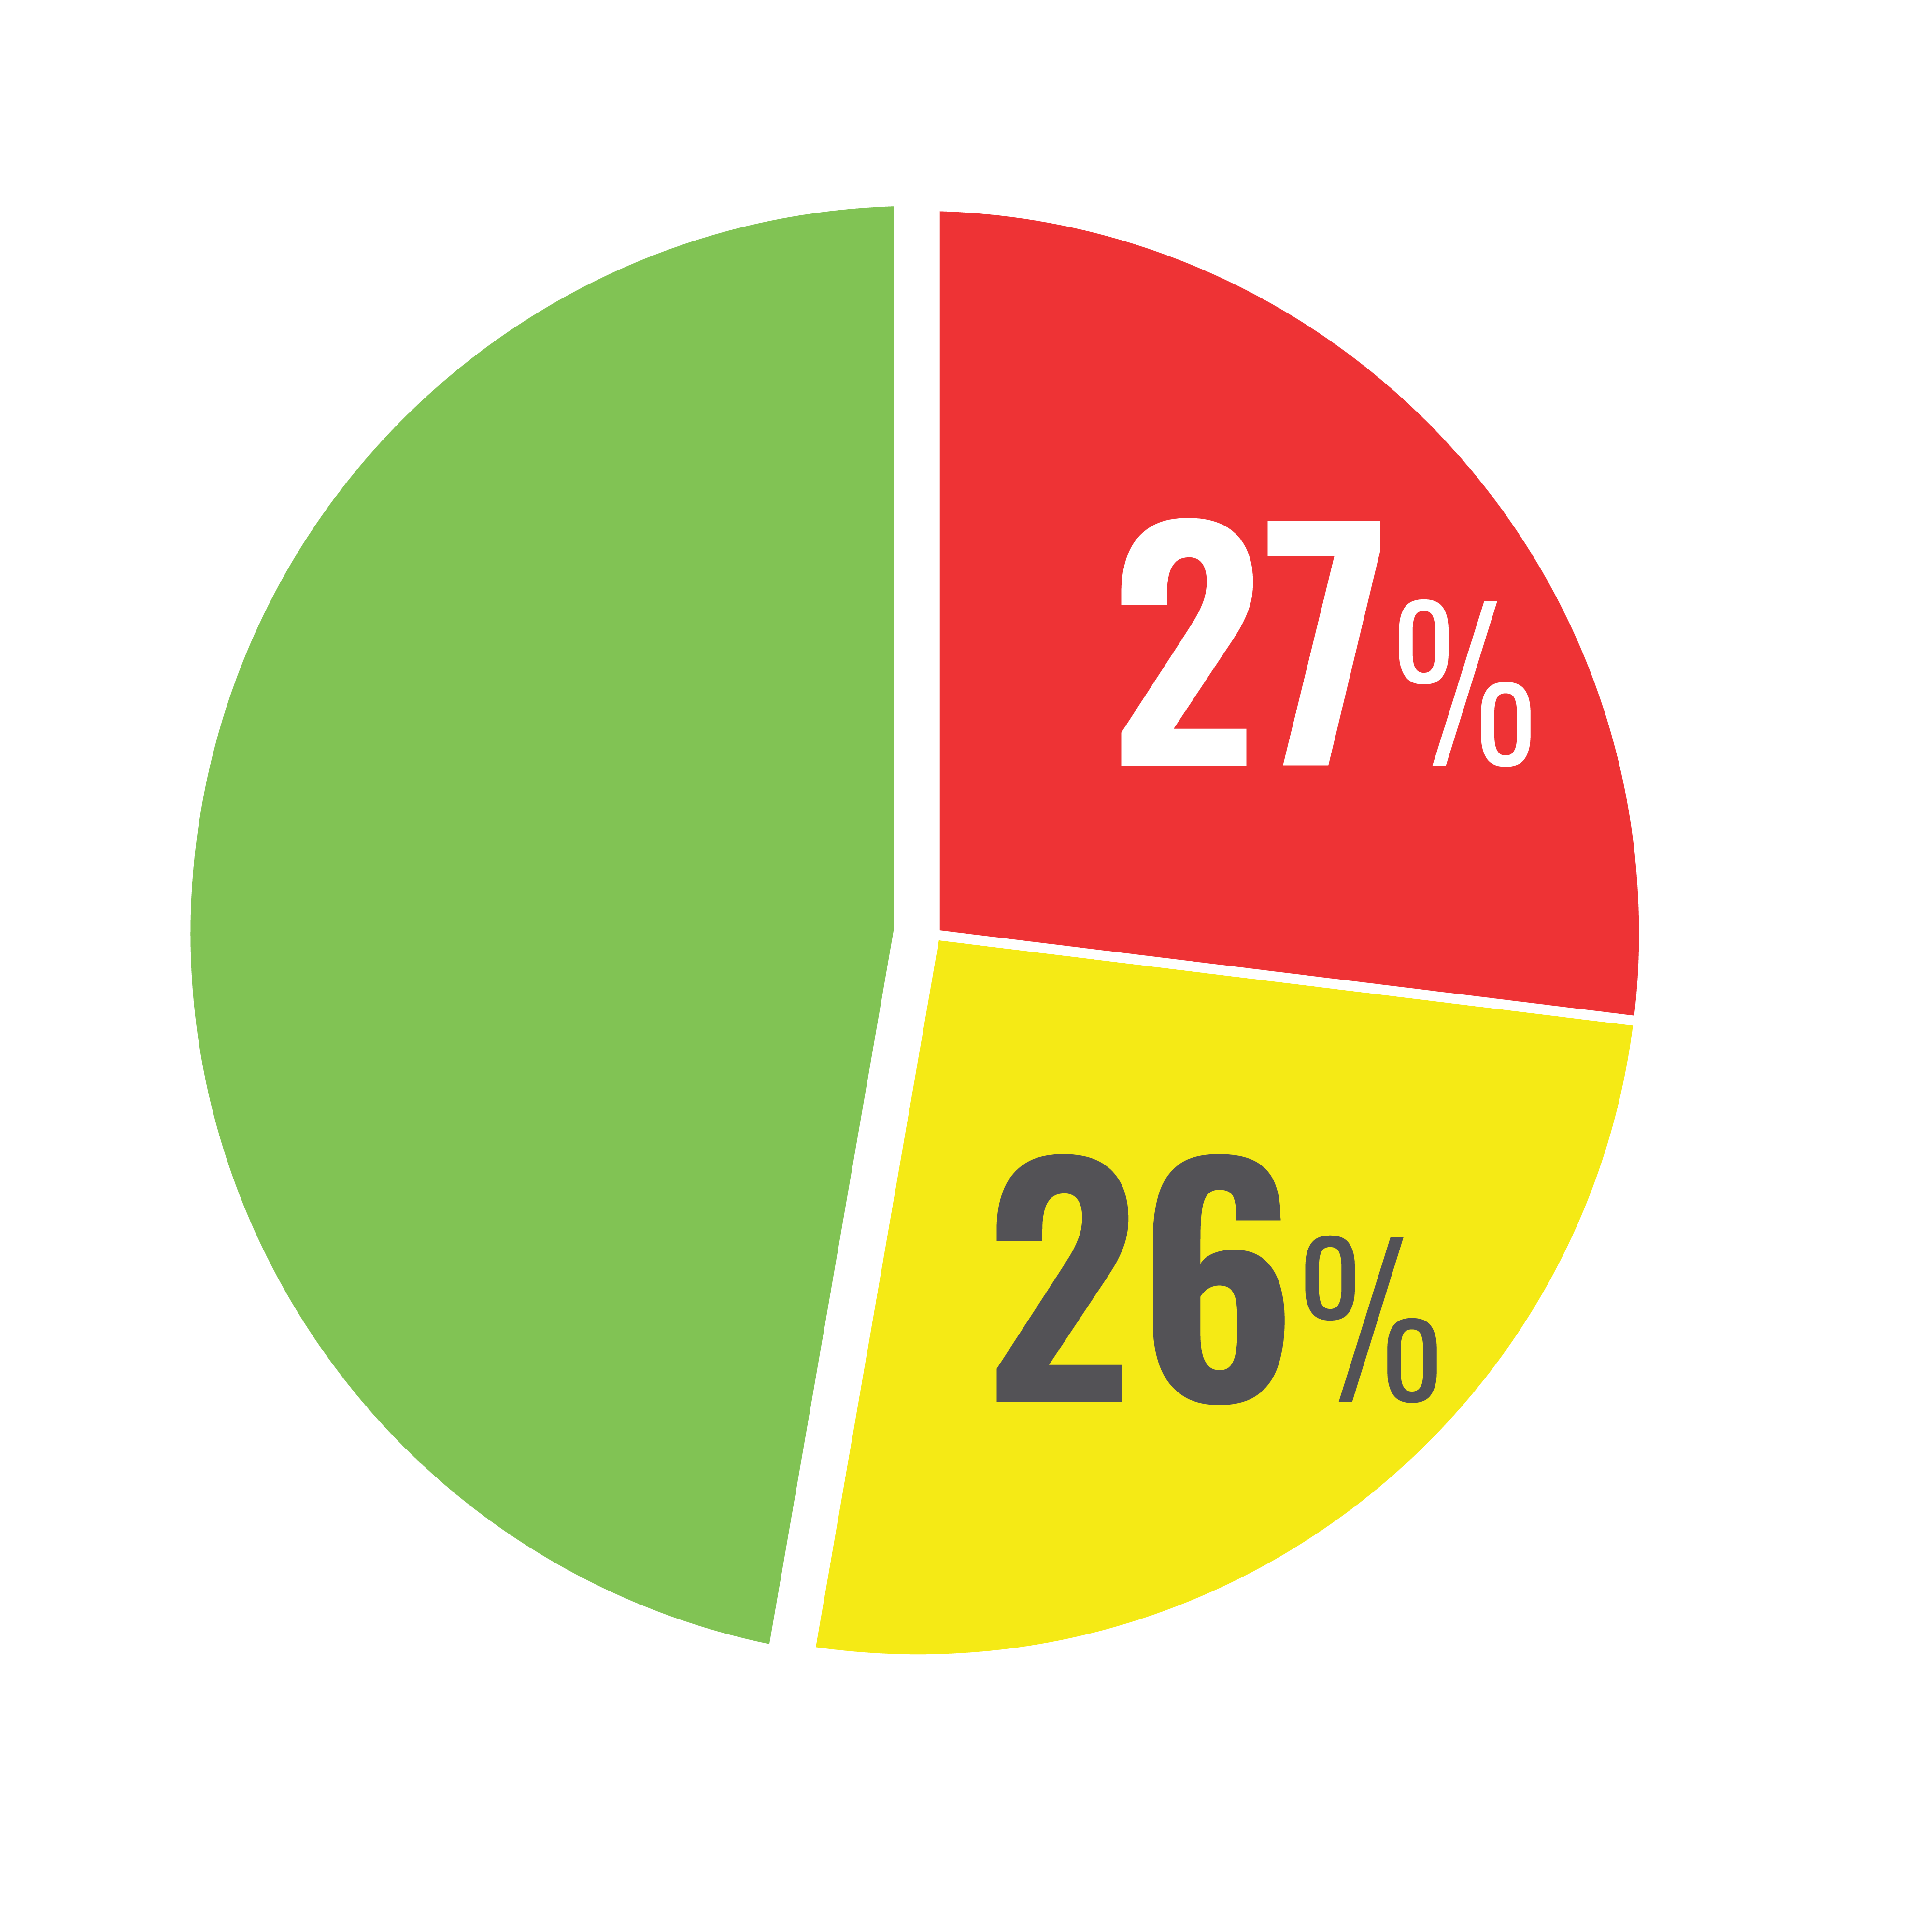
Carbon dioxide is elevated (over 1,000ppm) in 27% of homes, and between 800-999ppm in 26% of homes.
ACKNOWLEDGEMENTS
Thank you to the thousands of people that made this possible. It is from your collective hard work that we have this unique information to learn from.
Special thanks to Dr. Elliott Gall and the Portland State University team.
